- 了解如何看數據
- 類別型數據
- 數值型數據
- 單一數據
- 兩欄數據
EDA with R
智庫驅動
Wush Wu
EDA的複習
今天的目標
學習R 語言
- 透過實際的範例學習R 語言
- 讀取資料
- 選取資料
- 敘述統計量
- 視覺化
工欲善其事,必先利其器
Rstudio 界面
- 程式碼編輯區
- 命令列區
- 其他資訊區
- 檔案系統區
熟悉R 和Rstudio的界面
- 了解輸入
- 了解輸出
- 中斷程式
熟悉R 和Rstudio的界面 - 請你跟我這樣做
命令列區
- 注意最左下腳的符號是
> - 輸入
"hello world"後按下Enter,檢查螢幕輸出(記得加上引號) - 輸入
1 + 1後按下Enter,檢查螢幕輸出,注意有無引號 - 輸入
1 +後按下Enter,檢查螢幕輸出,注意最左下角的開頭變成+ - 按下Ctrl + C或ESC,檢查哪一個按鈕會讓左下角回復成
>開頭
熟悉R 和Rstudio的界面 - 請你跟我這樣做
命令列區
- 在新的一行命令列區輸入
he之後按下Enter - 在新的一行命令列區輸入
he之後按下tab
熟悉R 和Rstudio的界面 - 請你跟我這樣做
程式碼編輯區
- 建立新的R Script檔案
- 在第一行輸入
he隻後按下Ctrl + Enter後,觀察命令列區 - 利用滑鼠點選
he後的位置,確認游標閃爍的位置在he之後,按下tab
R 的擴充功能
CRAN Task Views

套件的安裝
UI
- 請見Demo
命令列
install.views("topic-name")
install.packages("pkg-name", repos = "來源")
小挑戰
套件安裝
- 利用UI安裝
magrittr - 透過USB 安裝課程所需套件
RSQLite,dplyr,ggplot2
# windows
utils:::menuInstallLocal()
# mac
{
  pkgpath <- file.choose()
  pkgdir <- paste(head(strsplit(pkgpath, "/")[[1]], -1), collapse="/")
  invisible(lapply(dir(pkgdir, "*.tgz", full.names = TRUE),
    install.packages, repos=NULL))
}
讓我們來說R 語
敘述句(expression)
"1;2;3;"
## [1] "1;2;3;"
1;2;3;
## [1] 1
## [1] 2
## [1] 3
- 敘述句以
;或斷行(輸入Enter)作結尾 - R 會把單引號
'或雙引號"所包覆的敘述當成字串 - 沒有完成的敘述句,命令列的開頭會變成
+ - 可以用Ctrl + C 中斷敘述句
註解
#之後的程式碼會被當成註解- R 會完全忽略註解
- 註解的功用是增加程式碼的可讀性
1;2;#3
## [1] 1
## [1] 2
敘述句與數值運算
1 + 1
## [1] 2
1 + 2 - 1
## [1] 2
(1 + 1) * 2
## [1] 4
2.5e3
## [1] 2500
- 敘述句可以運算出一個R 物件
- 運算的順序符合先乘除後加減,括號最優先
- 中間有
e的數值代表要再乘以10的冪次方
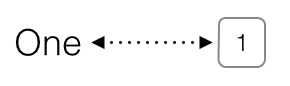
變數與賦值 <-或=
One
## Error in eval(expr, envir, enclos): 找不到物件 'One'
One <- 1
One
## [1] 1
Two = "2"
Two
## [1] "2"
賦值

\[\Downarrow\]
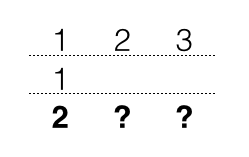
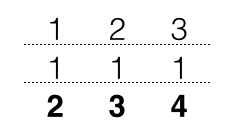
向量
1:3
## [1] 1 2 3
c(1, 2, 3) + 1
## [1] 2 3 4
1:3 * 2
## [1] 2 4 6
- 利用
c和建立向量 - 利用
:建立序列 - 運算是向量式的
呼叫函數
請在Rstudio的命令列區進行以下操作
- 輸入
c,按下tab- 自動完成:列出所有
c開頭的函數 - 列出函數的說明文件
- 自動完成:列出所有
- 清空命令列,輸入
?c後按下Enter - 清空命令列,輸入
c後按下Enter
函數與參數
- 函數的參數可以改變函數的行為
- R 的函數是依照以下方式來解釋參數:
- 名稱的partial matching
- 順序
......之後的參數
- 專家區
- R 的參數都是使用Pass By Value
- 參數的複製是採用Copy on Write
小挑戰
請利用+、-、*或/來回答:
# ubike在捷運市政府站(3號出口)站點於2015-03-01的每小時降雨量
rainfall1 <- c(0.157,0.432,0.702,0.947,1.129,1.224,1.241,
  1.218,1.201,1.207,1.225,1.233,1.227,1.218,1.22,1.233,
  1.244,1.246,1.242,1.242,1.249,1.257,1.258,1.252)
# ubike在大鵬華城站點 於2015-03-01的每小時降雨量
rainfall2 <- c(0.041,0.315,0.586,0.83,1.013,1.108,1.124,
  1.102,1.085,1.091,1.108,1.116,1.11,1.102,1.104,1.116,
  1.127,1.129,1.126,1.125,1.132,1.14,1.141,1.136)
rainfall1每小時的降雨量和rainfall2的差距
R 的資料結構
資料的類型
- 數值型變數
- 類別型變數
R 的數值型態:專用於數值型變數
- 數值型態
- 整數(integer)
1L - 實數(numeric)
1.5
- 整數(integer)
99L;99.5
## [1] 99
## [1] 99.5
R 的特殊數值型態
- 時間
Sys.time()
## [1] "2015-04-12 12:55:28 CST"
ISOdatetime(year = 1970, month = 1, day = 1,
            hour = 0, min = 0, sec = 0)
## [1] "1970-01-01 CST"
R 的類別型態
- 字串(character)
"1" - 類別(factor)
factor(1)
c("011", "012");factor(c("信義區","大安區","信義區"))
## [1] "011" "012"
## [1] 信義區 大安區 信義區
## Levels: 大安區 信義區
查詢變數的類別
x <- 1:3
class(x)
## [1] "integer"
x <- factor(c("1", "2", "3"))
class(x)
## [1] "factor"
資料型態的轉換 - 將數值轉換為類別
直接轉換
x <- c(1, 2, 3, 2, 3, 2, 1)
as.character(x) # 字串
## [1] "1" "2" "3" "2" "3" "2" "1"
factor(x) # 類別
## [1] 1 2 3 2 3 2 1
## Levels: 1 2 3
資料型態的轉換 - 將數值轉換為類別
分級
x <- c(75, 81, 82, 76, 91, 92)
cut(x, breaks = c(70, 80, 90, 100))
## [1] (70,80]  (80,90]  (80,90]  (70,80]
## [5] (90,100] (90,100]
## Levels: (70,80] (80,90] (90,100]
資料型態的轉換 - 將字串轉換為數值
直接轉換
x <- c("1", "2", "3", "2", "a")
as.numeric(x)
## Warning: 強制變更過程中產生了 NA
## [1] 1 2 3 2 NA
NA代表Not available,代表著missing value
資料型態的轉換 - 資料清理
民國80年至82年的國民生產毛額
百萬元
5,023,763
5,614,679
6,205,338
gdp <- c("5,023,763", "5,614,679", "6,205,338")
as.numeric(gsub(",", "", gdp))
## [1] 5023763 5614679 6205338
R 是向量式
- 所有的資料都是向量
- 上述介紹的整數、實數、字串和類別型都是相同型態的向量
list是R 物件的向量data.frame是長度相同的R 物件的向量
data.frame是最常使用的物件
data.frame的概念在各種資料處理的領域非常常見- 例:資料庫
- (實務經驗)R 使用者會希望能透過前處理把資料轉換為
data.frame的型式 - R 提供將資料匯入成
data.frame的功能 - R 提供自
data.frame開始的各種進階處理功能- 資料的整理
- 圖形的繪製
- 模型的配適與預測
小挑戰
- 請問根據以下的輸出,這份ubike的各欄類別為何?
| date | factor | tot | integer | min.bemp | integer |
| hour | integer | avg.sbi | numeric | std.bemp | numeric |
| sno | integer | max.sbi | integer | temp | numeric |
| sarea | factor | min.sbi | integer | humidity | numeric |
| sna | factor | std.sbi | numeric | pressure | numeric |
| lat | numeric | avg.bemp | numeric | max.anemo | numeric |
| lng | numeric | max.bemp | integer | rainfall | numeric |
小挑戰
- 請問根據中文名稱,這份ubike的各欄類別是否合理?
## Warning in file(file, "rt"):
## 無法開啟檔案 'ubike-cname.csv' :No
## such file or directory
## Error in file(file, "rt"): 無法開啟連結
## Error in eval(expr, envir, enclos): 找不到物件 'ubike.cname.raw'
## Error in function_list[[k]](value): 找不到物件 'ubike.cname'
## Error in split(ubike.ctype, rep(1:3, each = 7)): 找不到物件 'ubike.ctype'
函數會根據資料型態不同而有不同的行為
- 專家區
- 一種方式是作用在函式內部
- 一種是透過S3系統達成,例如:
print.factorprint.data.frameprint.default
資料的讀取
讀取表格檔案 - 0. 先抓取資料
- 抓取ubike和天氣的資料
- 可至
http://data.dsp.im/dataset/youbike-and-weather-data-20150331 - 可透過USB 隨身碟
- 可至
讀取表格檔案 - 1. 先檢視資料
# path <- "data/ubikeweatherbig5.csv"
# path <- "data/ubikeweatherutf8.csv"
path <- file.choose()
readLines(path, n = 5)
讀取表格檔案 - 2. 讀取資料
- 先讀取一部分,再讀取全部
ubike <- read.table(path, sep = ",", header = TRUE, nrows = 100)
head(ubike)
ubike <- read.table(path, sep = ",", header = TRUE,
  colClasses = c("factor", "integer", "integer", "factor", "factor",
    "numeric", "numeric", "integer", "numeric", "integer", "integer",
    "numeric", "numeric", "integer", "integer", "numeric", "numeric",
    "numeric", "numeric", "numeric", "numeric"))
# object.size(ubike) # 約86MB
常見的讀取錯誤
路徑錯誤
path <- "wrong_path"
power <- read.table(file = path, header = TRUE, sep = ",")
## Warning in file(file, "rt"):
## 無法開啟檔案 'wrong_path' :No such
## file or directory
## Error in file(file, "rt"): 無法開啟連結
- 絕對路徑
- 確認檔案是否存在
- 相對路徑
- 利用
getwd了解R 當下的路徑位置
- 利用
常見的讀取錯誤
格式錯誤
path <- "data/ubikeweatherbig5.csv"
power <- read.table(file = path, header = TRUE, sep = "1")
## Error in read.table(file = path, header = TRUE, sep = "1"): more columns than column names
- 利用其他編輯器確認分隔符號
- 確認每列的資料的欄位是正確的
- 必要時,請用其他文件編輯器校正欲讀取的檔案
常見的讀取錯誤
編碼錯誤
path <- "data/ubikeweatherbig5.csv"
power <- read.table(file = path, header = TRUE, sep = ",", nrows = 10)
錯誤在type.convert(data[[i]], as.is = as.is[i], dec = dec, numerals = numerals,  :
  無效的多位元組字串於 '<ab>H<b8>q<b0><cf>'
- 查詢檔案的編碼
- 常見的中文編碼有
UTF-8和BIG-5 - 讀取時套上
file函數指定編碼 - 組合
readLines、iconv和write來製造符合系統編碼的檔案
- 常見的中文編碼有
ubike是一種data.frame
class(ubike)
## [1] "data.frame"
校正欄位名稱
colnames(ubike) <-
  c("日期", "時間", "場站代號", "場站區域", "場站名稱",
  "緯度", "經度", "總停車格", "平均車輛數", "最大車輛數",
  "最小車輛數", "車輛數標準差", "平均空位數", "最大空位數",
  "最小空位數", "空位數標準差", "平均氣溫", "溼度",
  "氣壓", "最大風速", "降雨量")
存取資料庫: SQLite
library(RSQLite)
## Loading required package: DBI
db.path <- "ubike.db"
drv <- dbDriver("SQLite")
db <- dbConnect(drv, db.path)
dbWriteTable(db, "ubike", head(ubike))
dbListTables(db)
dbReadTable(db, "ubike")
dbDisconnect(db)
未來的學習清單
各式資料庫的連接
- SQL Database:
RMySQL,RPostgreSQL,ROracle,RJDBC,RODBC - No SQL Database:
rmongodb,rredis - 讀取XML和網頁資料
XML套件和XPath
- 讀取json資料
RJSONIO套件
更擅長整理資料的工具:python

資料的選取
布林運算
><>=<===!=
1 > 2;1 <= 2
## [1] FALSE
## [1] TRUE
"A" == "A";"A" != "A"
## [1] TRUE
## [1] FALSE
向量的選取
坐標
x <- 1:5; x[2:3]
## [1] 2 3
布林
x <- 1:5; x > 3; x[x > 3]
## [1] FALSE FALSE FALSE TRUE TRUE
## [1] 4 5
多重條件
- 且:
&布林運算結果1 & 布林運算結果1
- 或:
|布林運算結果1 | 布林運算結果1
小挑戰
# 社會服務業自民國87至民國91年的年度用電量(度)
power1 <- c(6097059332, 6425887925, 6982579022, 7323992602.53436, 7954239517)
# 製造業自民國87至民國91年的年度用電量(度)
power2 <- c(59090445718, 61981666330, 67378329131, 66127460204.6482, 69696372914.6949)
運用index從
power1中選取第88年和第90年的年度用電量。結果應該為:## [1] 6425887925 7323992603運用布林運算自
power2中選出,製造業超過社會服務業9.5倍的用電年度的用電量。結果應該為:## [1] 59090445718 61981666330 67378329131
表格的選取 - 座標
ubike[2, 3]
## [1] 2
##         日期 時間 場站代號
## 1 2014-12-08   15        1
## 2 2014-12-08   15        2
## 3 2014-12-08   15        3
## 4 2014-12-08   15        4
## 5 2014-12-08   15        5
## 6 2014-12-08   15        6
表格的選取 - 欄
head(ubike[["日期"]])head(ubike[,1])
## [1] 2014-12-08 2014-12-08 2014-12-08
## [4] 2014-12-08 2014-12-08 2014-12-08
## 108 Levels: 2014-12-08 ... 2015-03-31
## [1] 2014-12-08 2014-12-08 2014-12-08
## [4] 2014-12-08 2014-12-08 2014-12-08
## 108 Levels: 2014-12-08 ... 2015-03-31
範例
- 自
ubike選取場站代號 - 將結果1.輸入至函數
unique - 利用布林運算,把1.的結果和
1比較 - 將結果3.輸入至函數
which - 利用3.和4.的結果選取ubike的列
ans1 <- ubike[["場站代號"]]
ans2 <- unique(ans1)
ans3 <- ans1 == 1
ans4 <- which(ans3)
ans5 <- ubike[ans3,]
ans5 <- ubike[ans4,]
小挑戰
- 請查詢場站代號1099所在的行政區
- 請查詢場站代號1099的氣溫
- 自
ubike選取場站代號 - 利用布林運算,把1.的結果和
1099比較 - 自
ubike選取2.的列之後,用1.的方法選取平均氣溫3.1 可利用座標的概同時選取出結果
- 自
指令的壓縮
- 請大家學習「被壓縮的程式碼」該如何解讀
- 掌握運算符號的運算順序
ubike[ubike[["場站代號"]] == 1 & ubike[["日期"]] == "2015-03-01",]

x1 <- ubike[["場站代號"]] == 1
x2 <- ubike[["日期"]] == "2015-03-01"
x3 <- x1 & x2
x4 <- ubike[x3,]
2014 年最有影響的套件之一:magrittr
- 壓縮的程式碼不好讀
- 展開的程式碼會產生很多暫存變數
- 套件
magrittr部份解決了這個問題
ans1 <- ubike[["場站代號"]]
ans1.1 <- unique(ans1)

unique(ubike[["場站代號"]])

library(magrittr)
ubike[["場站代號"]] %>%
  unique
2014 年最有影響的套件之一:dplyr
- 讓R 使用者可以用更有彈性的方式來處理資料
- 針對
data.frame做設計(名稱中的d) - 設計理念
- 導入資料整理最重要的動作(非常類似SQL)
- 快
- 支援異質資料源(
data.frame或資料庫中的表格)
學習dplyr的官方方式:vignette
vignette(all = TRUE, package = "dplyr")
vignette("introduction", package = "dplyr")
- 更詳細的dplyr介紹可以閱讀dplyr的小論文
- R 的開發者會針對一個主題撰寫小論文做介紹
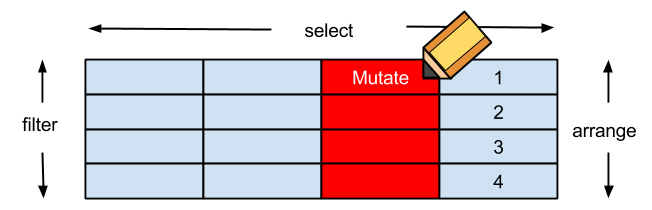
dplyr簡介
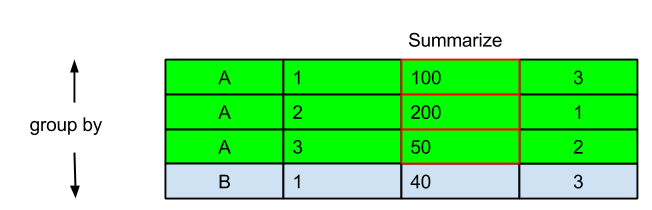
filter對列做篩選select對欄做篩選mutate更改欄或新增欄arrange排列- **
group_by+summarise分類
資料的探索
探索一個變數
量化數據
- 敘述統計量:
mean、sd、median
質化數據
- 分佈表格:
table - 眾數:
table+sort
利用說明文件了解函數內容
範例:學習mean的用法
- 閱讀說明文件
?mean - 嘗試範例
example(mean) - 自動完成
- 在命令列輸入
mena(後按下tab
- 在命令列輸入
探索一個量化變數
挑戰:學習sd的用法
- 透過
?sd嘗試自學標準差的用法 - 選取
場站代號為1和日期為"2015-03-01"的資料 - 計算
捷運市政府站(3號出口)在"2015-03-01"的降雨量的標準差
各行政區的站點數:學習group_by
lengthmean、sd、medianlength(unique)paste(unique, collapse = ",")
每日的平均雨量
group_by(ubike, 日期) %>%
  summarise(平均降雨量 = mean(降雨量))
各場站區域的站點數
group_by(ubike, 場站區域) %>%
  summarise(站點數 =
    length(unique(場站代號))) %>%
  arrange(站點數)
各場站區域的站點數
group_by(ubike, 場站區域) %>%
  summarise(站點代號清單 =
    paste(unique(場站代號),
          collapse = ","))
探索一個質化變數
- 利用
table列出所有的場站名稱出現的次數
探索變數間的關係
ftable:質化 v.s. 質化- bar chart:質化 v.s. 量化
- scatter plot: 量化 v.s. 量化
探索質化變數與質化變數的關係
?ftable
example(ftable)
ftable> ## Start with a contingency table.
ftable> ftable(Titanic, row.vars = 1:3)
                   Survived  No Yes
Class Sex    Age
1st   Male   Child            0   5
             Adult          118  57
      Female Child            0   1
             Adult            4 140
小挑戰:
- 選取場站區域為
信義區且日期為"2015-03-01"的列 - 選取欄
平均車輛數與總停車格 - 利用布林運算式計算"
平均車輛數"是否超過總停車格的一半- 命名為
空位較多
- 命名為
- 選取欄
時間 - 比較
時間和空位較多的交互關係
小挑戰(參考答案)
x1 <- ubike[["場站區域"]] == "信義區"
x2 <- ubike[["日期"]] == "2015-03-01"
x3 <- ubike[x1 & x2, "平均車輛數"]
x4 <- ubike[x1 & x2, "總停車格"]
x5 <- x3 < x4 / 2
x6 <- ubike[x1 & x2, "時間"]
ftable(x6, x5)

x1 <- filter(ubike, 場站區域 == "信義區", 日期 == "2015-03-01")
x2 <- mutate(x1, 空位較多 = 平均車輛數 < 總停車格 / 2)
ftable(x2[["時間"]], x2[["空位較多"]])

tbl <- filter(ubike, 場站區域 == "信義區", 日期 == "2015-03-01")  %>%
  mutate(空位較多 = 平均車輛數 < 總停車格 / 2)
ftable(tbl[["時間"]], tbl[["空位較多"]])
ggplot2 簡介
ggplot2 的核心思想
- 先把資料適當的整理成
data.frame - 將
data.frame送至ggplot函數 - 各種繪圖工具利用
aes定位欄位和對應的圖的元素- x座標、y座標、顏色、分群
- 一層一層的疊上繪圖要素
- 點、線、各種文字與標題說明
質化 v.s. 量化:繪圖之前的整理資料
信義區各站點在"2015-02"的平均降雨量
# grepl("要搜尋的字串", x, fixed = TRUE)
x1.1 <- grepl("2015-02", ubike[["日期"]], fixed = TRUE)
x1.2 <- ubike[["場站區域"]] == "信義區"
x2 <- group_by(ubike[x1.1,], 場站名稱)
x3 <- summarise(x2, 平均降雨量 = mean(降雨量))

x3 <- filter(ubike, grepl("2015-02", 日期, fixed = TRUE),
             場站區域 == "信義區") %>%
  group_by(場站名稱) %>% summarise(平均降雨量=mean(降雨量))
質化 v.s. 量化:barchart
thm <- theme(text=element_text(size=18)) + theme_gray(base_family = "STHeiti")
las2 <- theme(axis.text.x = element_text(angle = 90, hjust = 1))

ggplot(x3) +
  geom_bar(aes(x = 場站名稱, y = 平均降雨量), stat = "identity") +
  thm + las2
質化 v.s. 量化:boxplot
x1.1 <- grepl("2015-02", ubike[["日期"]], fixed = TRUE)
x1.2 <- ubike[["場站區域"]] == "信義區"
x2 <- group_by(ubike[x1.1,], 場站名稱)
# x3 <- summarise(x2, 平均降雨量 = mean(降雨量))

x3 <- filter(ubike, grepl("2015-02", 日期, fixed = TRUE),
             場站區域 == "信義區") # %>%
#  group_by(場站名稱) %>% summarise(平均降雨量=mean(降雨量))

ggplot(x3) +
  geom_boxplot(aes(x = 場站名稱, y = 降雨量)) +
  thm + las2
量化 v.s. 量化:繪圖之前的整理資料
信義區各站點在"2015-02"的平均溼度 vs. 平均雨量
# grepl("要搜尋的字串", x, fixed = TRUE)
x1.1 <- grepl("2015-02", ubike[["日期"]], fixed = TRUE)
x1.2 <- ubike[["場站區域"]] == "信義區"
x2 <- group_by(ubike[x1.1,], 場站名稱)
x3 <- summarise(x2, 平均降雨量 = mean(降雨量), 平均溼度 = mean(溼度))

x3 <- filter(ubike, grepl("2015-02", 日期, fixed = TRUE),
             場站區域 == "信義區") %>%
  group_by(場站名稱) %>% summarise(平均降雨量 = mean(降雨量), 平均溼度 = mean(溼度))
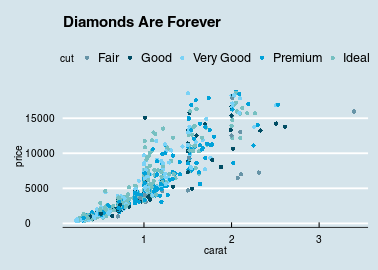
量化 v.s. 量化:Scatter Plot
- 原因在x軸,結果在y軸
ggplot(x3) +
  geom_point(aes(x = 平均溼度, y = 平均降雨量)) +
  thm + las2
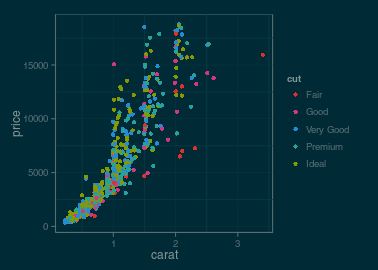
量化 v.s. 量化:Grouped Scatter Plot
ggplot(x3) +
  geom_point(aes(x = 平均溼度, y = 平均降雨量, colour = 場站名稱)) +
  thm + las2
圖形的美化
Maker精神:雕圖
- 學習更底層的繪圖指令,如
grid套件 - 學習原生的繪圖指令
站在巨人的肩膀上
- 使用如
ggthemes等套件
ggthemes
圖表的輸出
輸出圖片
- Rstudio UI
savePlotbmp、png、jpeg或tiff
輸出表格
write.csvxtable套件
R markdown 火力展示
- 請見現場live demo
shiny
總結
本週目標
環境設定
- 建立可以使用R 的環境
- 了解R 的使用界面
學習R 語言
- 透過實際的範例學習R 語言
- 讀取資料
- 選取資料
- 敘述統計量與視覺化
- 利用實例來傳授學習的心法
掌握心法後,如何自行利用R 解決問題
- 了解自己的需求
- 詢問關鍵字與函數
- 歡迎來信 wush978@gmail.com 或其他教師
- 多多交流
- Taiwan R User Group,mailing list: Taiwan-useR-Group-list@meetup.com
- ptt R_Language版
- R軟體使用者論壇
sos套件,請見Demo
你喜歡R 嗎?
- R 是由一群來自世界上的志工貢獻而成的
- 你覺得R 有不好用的地方嗎?
- 歡迎聯絡我,讓我們一起來貢獻,改進R 的使用體驗
- 歡迎企業聯繫DSP ,我們可以提供R 的客製化服務